- SnapLogic - Integration Nation
- Designing and Running Pipelines
- Re: List started pipelines regardless of start dat...
- Subscribe to RSS Feed
- Mark Topic as New
- Mark Topic as Read
- Float this Topic for Current User
- Bookmark
- Subscribe
- Mute
- Printer Friendly Page
- Mark as New
- Bookmark
- Subscribe
- Mute
- Subscribe to RSS Feed
- Permalink
- Report Inappropriate Content
10-05-2017 01:45 PM
I need to determine which pipelines are currently running regardless of when they started. It appears the Pipeline Monitoring API only returns pipelines that have started within the last_hours parameter (although I can’t seem to determine proper values for the start and end parameters - they are defined as “timestamp in milliseconds” - milliseconds since when?).
We have continuously running pipelines that may have been started more than 90 days ago, which I believe is beyond the start limit of the Pipeline Monitoring API. I need this information to determine if all pipelines are executing as they should. How can I determine which pipelines are running regardless of their start date? Thanks in advance!
Solved! Go to Solution.
- Mark as New
- Bookmark
- Subscribe
- Mute
- Subscribe to RSS Feed
- Permalink
- Report Inappropriate Content
10-12-2017 12:42 PM
As an interim solution, have you tried manipulating the data returned by the results of the Snaplex Monitoring API? There is quite a bit of information returned, but at a Snaplex node level, you will have visibility of all active runtime IDs in the active_pipelines array. The runtime IDs could then be resolved using the Pipeline Monitoring API to mine additional, granular details.
- Mark as New
- Bookmark
- Subscribe
- Mute
- Subscribe to RSS Feed
- Permalink
- Report Inappropriate Content
10-06-2017 05:11 AM
How does Dashboard report them as “Started” if they were started more than 90 days ago? I just want a simple list of what pipelines are running currently without having to run some OS or JCC-level commands on the node.
- Mark as New
- Bookmark
- Subscribe
- Mute
- Subscribe to RSS Feed
- Permalink
- Report Inappropriate Content
10-06-2017 06:03 AM
The only possibility for a task to be in a “started” mode is an Ultra.
I have not seen an scheduled task run that long.
Triggered task is out of question.
- Mark as New
- Bookmark
- Subscribe
- Mute
- Subscribe to RSS Feed
- Permalink
- Report Inappropriate Content
10-06-2017 06:21 AM
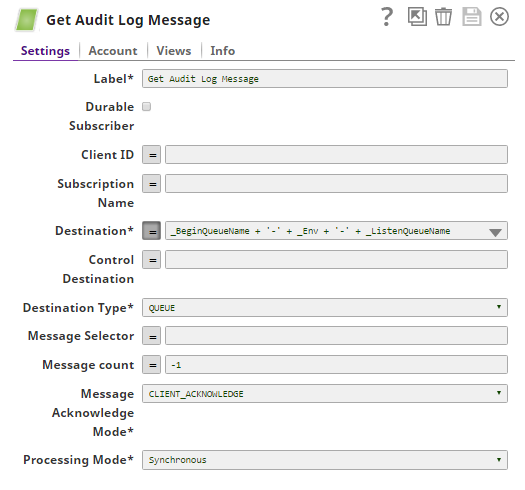
We have non-ultra pipelines running continuously due to the JMS Consumer snap configured to continuous mode as follows:
- Mark as New
- Bookmark
- Subscribe
- Mute
- Subscribe to RSS Feed
- Permalink
- Report Inappropriate Content
10-06-2017 06:29 AM
What makes the difference in whether a pipeline was started with a scheduled task vs. a triggered task for how long the pipeline runs?
Also, since SnapLogic quarterly updates require the nodes to be restarted nearly every 90 days no pipeline would run longer than the time between updates. If the API would allow us to go back as far as the last platform update that would resolve my issue. This should only be a few more days or weeks beyond the 90 day limit now, correct?
Or if there was a way to simply list the pipelines running on a snaplex, that would resolve the issue also… Is there a way I can do that within a pipeline?
- Mark as New
- Bookmark
- Subscribe
- Mute
- Subscribe to RSS Feed
- Permalink
- Report Inappropriate Content
10-06-2017 06:36 AM
did you try these options?
plex_label - string - fetch runtime for a particular Snaplex label
cc_label - string - fetch runtime for a particular cc label (jcc’s hostname)
user_id - string - fetch runtime for particular users
Example: user_id=user_a@example.com,user_b@example.com
project_path - string - fetch runtime for particular project
Example: project_path=/Snaplogic/projects/test_project
Format: /<org_name>/projects/<project_name>
Format: /<org_name>/shared
- SQS Consumer snap is ready all message at pipeline startup in Snap Packs
- SQS -pipeline stalling in Designing and Running Pipelines
- Pipeline Execute snap - An in-depth look in Designing and Running Pipelines
- Best Approach for Handling CSV Import with Truncate in Pipeline: Ensuring Correct Execution Order in Designing and Running Pipelines
- Intermittent Task Failure BAD_REQUEST: POST to pipeline that does not have an unlinked input view in Designing and Running Pipelines

