- SnapLogic - Integration Nation
- Designing and Running Pipelines
- Re: How to see the outputs and logs of the a pytho...
- Subscribe to RSS Feed
- Mark Topic as New
- Mark Topic as Read
- Float this Topic for Current User
- Bookmark
- Subscribe
- Mute
- Printer Friendly Page
How to see the outputs and logs of the a python script?
- Mark as New
- Bookmark
- Subscribe
- Mute
- Subscribe to RSS Feed
- Permalink
- Report Inappropriate Content
08-09-2021 07:09 AM
I have a pipeline which included a python script. Although the pipeline works properly but I cannot see the output of my script both in the data preview and also in the logs. E.g. when I download the logs I dont see this output:
self.log.info(" This is a python log")
Also the data preview somehow does not work for this specific pipeline although there is no special character in the project name which apparently is a known bug.
self.output.write("This is a python output")
Any idea on this would be appreciated.
- Mark as New
- Bookmark
- Subscribe
- Mute
- Subscribe to RSS Feed
- Permalink
- Report Inappropriate Content
08-09-2021 07:19 AM
Hi @irsl ,
What do you mean by the data preview does not work ? Is there no preview available or something else ? Can you elaborate on that ? Or maybe you forgot to set the snap mode to “Validate & Execute” ?
- Mark as New
- Bookmark
- Subscribe
- Mute
- Subscribe to RSS Feed
- Permalink
- Report Inappropriate Content
08-09-2021 08:39 AM
Hi @j.angelevski,
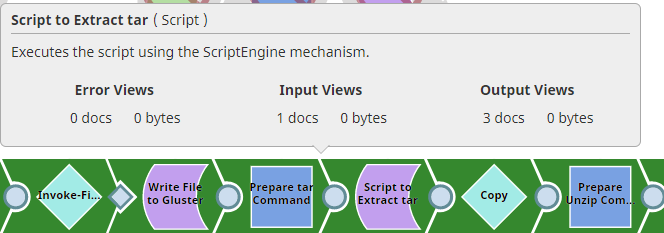
thank you for the response. I have checked and all snaps are in “Validate & Execute” mode. But still no preview is available. After running the script 3 docs are produced as shown in the screenshot below but I cannot see them in the preview:
The python script runs a cli command to extract a compressed file in tar format. I want to customise the script but I dont see any output or any logs from the script.
- Mark as New
- Bookmark
- Subscribe
- Mute
- Subscribe to RSS Feed
- Permalink
- Report Inappropriate Content
08-09-2021 11:50 AM
To me, this looks like you are executing the pipeline. When you execute the pipeline you can’t preview the data, you need to validate to be able to preview the output data.
You can see the difference between executed and validated pipeline. The first image is executed pipeline and is colored in a dark green color. The second image is when you validate and is colored with a light green color and you can see the preview icon for each snap.
- Mark as New
- Bookmark
- Subscribe
- Mute
- Subscribe to RSS Feed
- Permalink
- Report Inappropriate Content
08-09-2021 04:15 PM
Hello @irsl! @j.angelevski is correct, your pipeline has been executed instead of validated, which means you will not see the preview output.
I have a detailed response here for anyone new to SnapLogic or new to using the Script Snap with Python, so if you’re familiar with that please skip to the TLDR; section where I have a sample pipeline and video on how the pipeline works to untar files. In the designer you’re looking for the V inside the gear, which is the middle of these three icons from the toolbar (others shown for reference:)
Once a pipeline has successfully validated that icon will become a darker icon with a check mark in it like this:
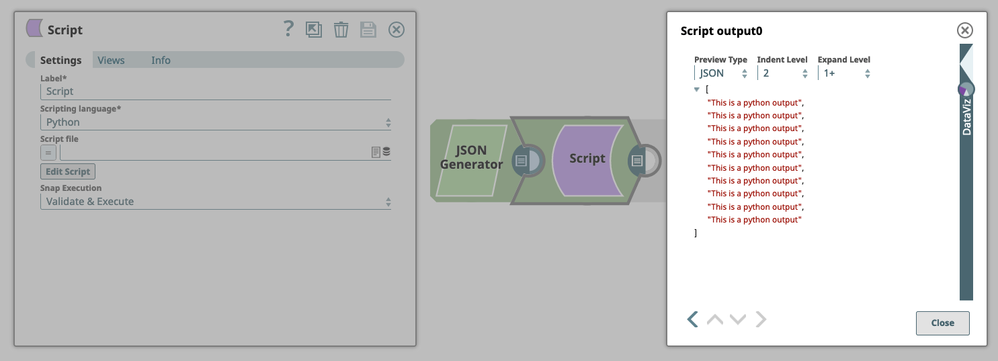
If you take the default Python Script template and replace the default self.output.write(inDoc, outDoc) with the line self.output.write("This is a python output"), the output would look like this, printed one time for each input document and without any JSON keys for reference:
I have ten records randomly generated from Mockaroo in my JSON Generator. To manipulate the JSON output from the Python Script snap I actually want to work with the ‘output’ dictionary, the one that looks like the snippet below. Since that snippet is in the while self.input.hasNext() block it is executed once for each incoming document. In other words, all it does it pass the incoming document, inDoc, through to the output under the $original key.
outDoc = {
   'original' : inDoc
}
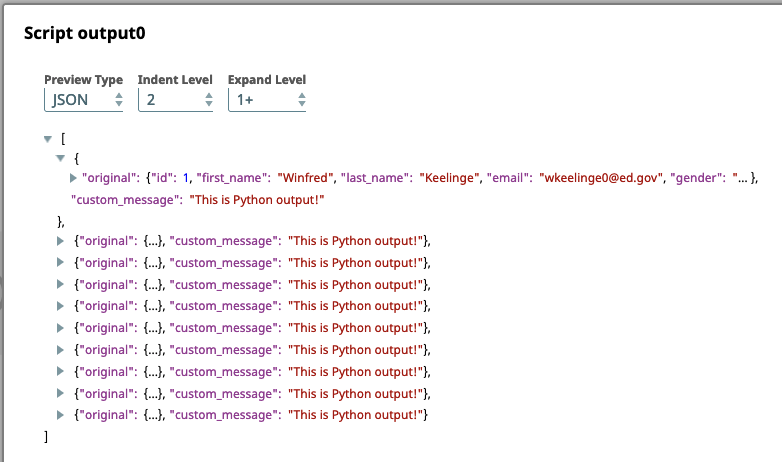
Now let’s say I want to output my original document AND a custom message. Here is the snippet that shows how we can do that.
outDoc = {
   'original' : inDoc
}
outDoc['custom_message'] = {
   "This is Python output!"
}
self.output.write(inDoc, outDoc)
Since the outDoc dictionary is created for capturing $original by default, I need make sure the content I want to add is appended to it instead of overwriting it. For example, if the second statement was outDoc = {‘custom_mesage’ : “This is python output!”} I would overwrite it. Here is a screenshot of the output now:
Accessing JSON keys within a record works in a similar fashion using inDoc. Looking at the screenshot you can see my incoming document has a “first_name” key so if I wanted to run some Python on just that field, I could reference it like inDoc['first_name'].
Now let’s talk about self.log.info(" This is a python log") which by default in the Script Snap would be self.log.info("Executing Transform script"). These messages will be written to the logs on the Snaplex node rather than in any place you can see in the Designer. If the pipeline was executed rather than validated so you can find it in the Dashboard, the little table icon in the Status column allows you to fetch the logs if they have not rolled on the node:
The files download as JSON and here is the line for the default self.log.info("Executing Transform script"):
{
    "Process": "Script[5592aed995315c0d2e1aaeeb_4a397c14-d757-419a-84cf-5e61c056f455 -- 55bbca61-0a87-4784-b08a-92224f953f33]",
    "TimeStamp": "8/9/2021 6:50 PM",
    "RuntimeID": "5592aed995315c0d2e1aaeeb_4a397c14-d757-419a-84cf-5e61c056f455",
    "File": "PyReflectedFunction.java:190",
    "Message": "Executing Transform script",
    "SnapLabel": "Script",
    "Exception": ""
}
If you had direct access to the logs on the Snaplex node it only looks slightly different:
{
    "ts": "2021-08-09T22:53:57.547Z",
    "lvl": "INFO",
    "fi": "PyReflectedFunction.java:190",
    "msg": "Executing Transform script",
    "snlb": "Script",
    "snrd": "6e759256-449e-4a9a-808d-4e8702629356",
    "plrd": "5592aed995315c0d2e1aaeeb_9b2d9e11-e85d-4c76-a05a-2434fc986d6e",
    "prc": "Script[5592aed995315c0d2e1aaeeb_9b2d9e11-e85d-4c76-a05a-2434fc986d6e -- 6e759256-449e-4a9a-808d-4e8702629356]",
    "xid": "94ea29d4-9722-4f42-9774-bda0cff3ce30"
}
TLDR;
I am attaching a pipeline and link to a video that shows how the pipeline works in case you or anyone else need help with that.
Untar Pipeline: UntarFile_2021_08_09.slp (13.2 KB)
Python Script Example Pipeline: Community_PythonScriptOutput_2021_08_09.slp (14.0 KB)
- Remove XML duplicate key from JSON list in XML formatter in Designing and Running Pipelines
- CSV parser cannot parse data in Designing and Running Pipelines
- Parsing XML using a Python script returns an encoding error message in Designing and Running Pipelines
- Mapper strange behaviour when using jsonpath to get array and sink to Snowflake in Designing and Running Pipelines
- Generic JDBC Execute snap with complex DB2 SQL -> ran into "Connection does not exist" Error in Snap Packs


